Reviewing and Editing a Simple Report
To begin familiarizing yourself with Report Center, we recommend that you begin by reviewing some of the existing out-of-the-box ClientSpace reports. A good starting place is a simple report such as the Cases By Type - Last 365 Days workbook.
Note:
-
You must have Explorer or Editor access to perform some of the tasks outlined in this topic. Remember: An Editor license type is required to view and personalize existing workbooks plus create new workbooks and use "join tables" functionality. An Editor can also change the base workbook file. An Explorer license type allows users to view and personalize existing workbooks. However, they cannot change the base workbook file. They can instead save a workbook view and then personalize it.
-
A Report Center workbook is the primary, saved container for data analysis (data, charts, and layout) acting as the "single source of truth". A workbook view (also referred to as a custom view) is a personalized layer built on top of a published workbook, allowing users to filter, sort, or explore data without altering the original, shared workbook. Therefore, users with Editor access can alter the "source" which impacts all related views.
Reviewing Filters
Filters display at the top of charts. The Cases By Type - Last 365 Days report has a pie chart which displays Date Created = Last 2 years, including current year and all case categories are checked under Category.
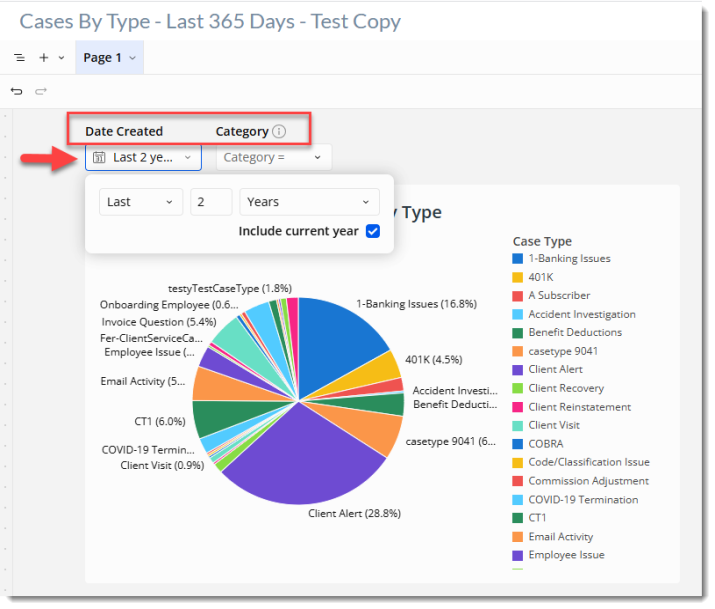
Experiment with opening the drop-down list and setting a different Date Created filter or removing some of the Category options.
Adding a Custom Field
In ClientSpace, with Izenda reporting, our out-of-the box reports could not contain any custom fields that you created. The data models containing the fields we created had to be maintained separately from fields created by your agency. This section covers how to modify an out-of-the box or "canned" report to point to a datasource containing custom fields and then add a custom field to the report.
To add a custom field to the report:
-
With the workbook open, click the Explore slider button to enter Explore mode.
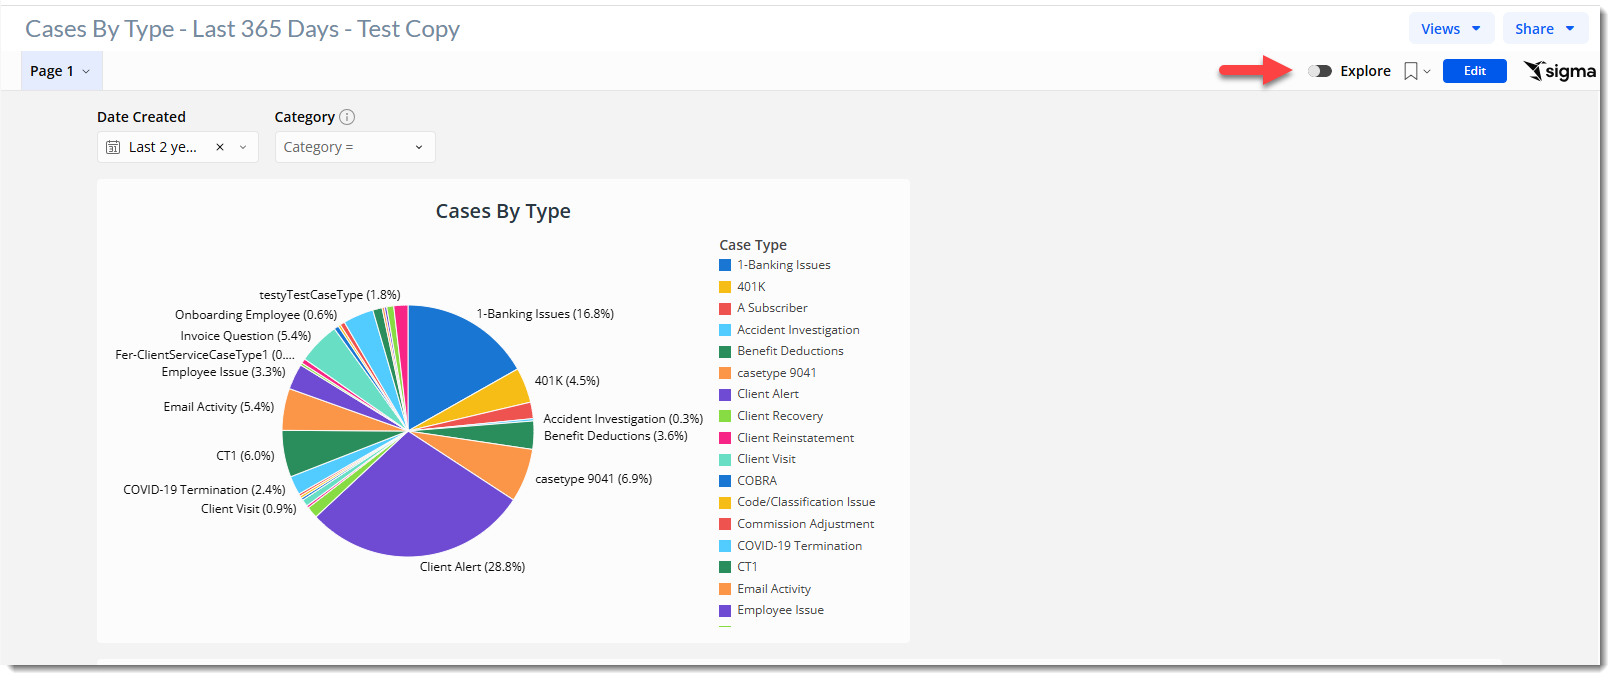
-
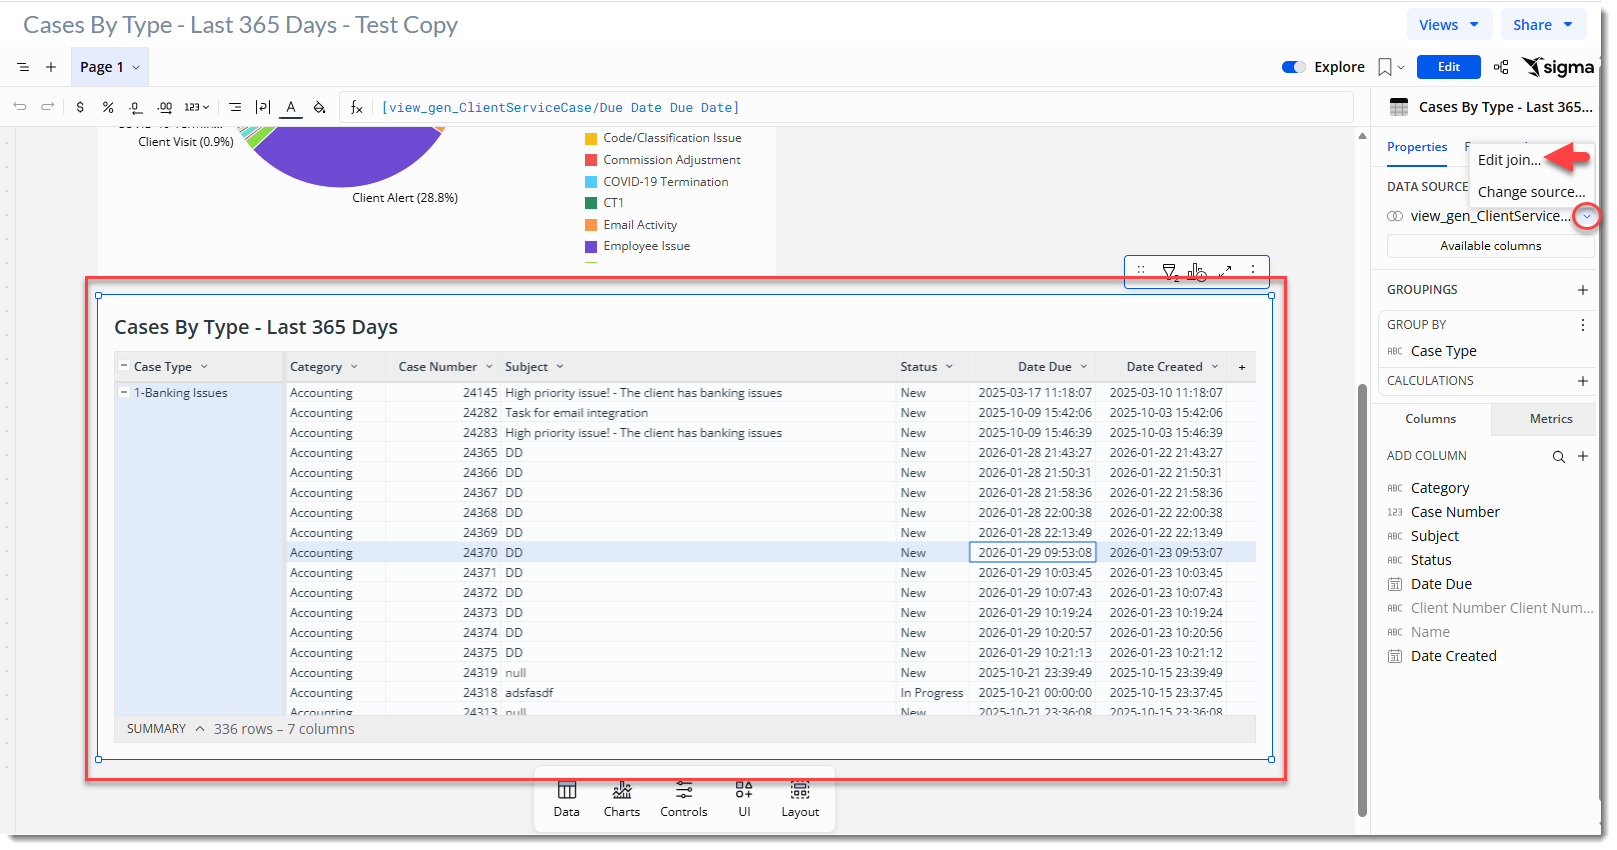
Click the Cases by Type - Last 365 Days grid (located beneath the pie chart) to select the element.
A right pane displays the Properties, Format and Actions tab.
-
On the Properties tab, click the down arrow next to the data source and select Edit join...
-
Click the plus symbol next to
SOURCES.The Select Source window displays.
-
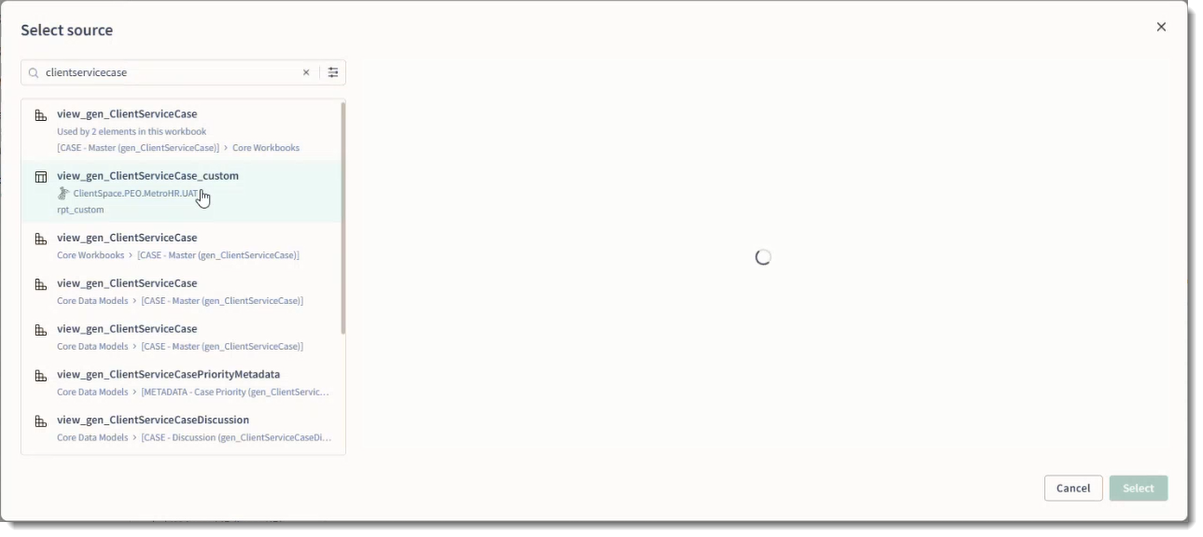
Type clientservicecase in the Search for data sources, or current workbook element field.
A list of matches displays on the Suggested tab. If you do not see the data source you are looking for, you can click the Elements and Data Sources tab to look at other options. However, in this test, we will select a Suggested source. Note that the
 icon next to a data source indicates a ClientSpace data model used for a "canned" report containing no custom fields while the
 icon is used to indicate a view or table containing custom fields. The view name will typically end with "_custom".
-
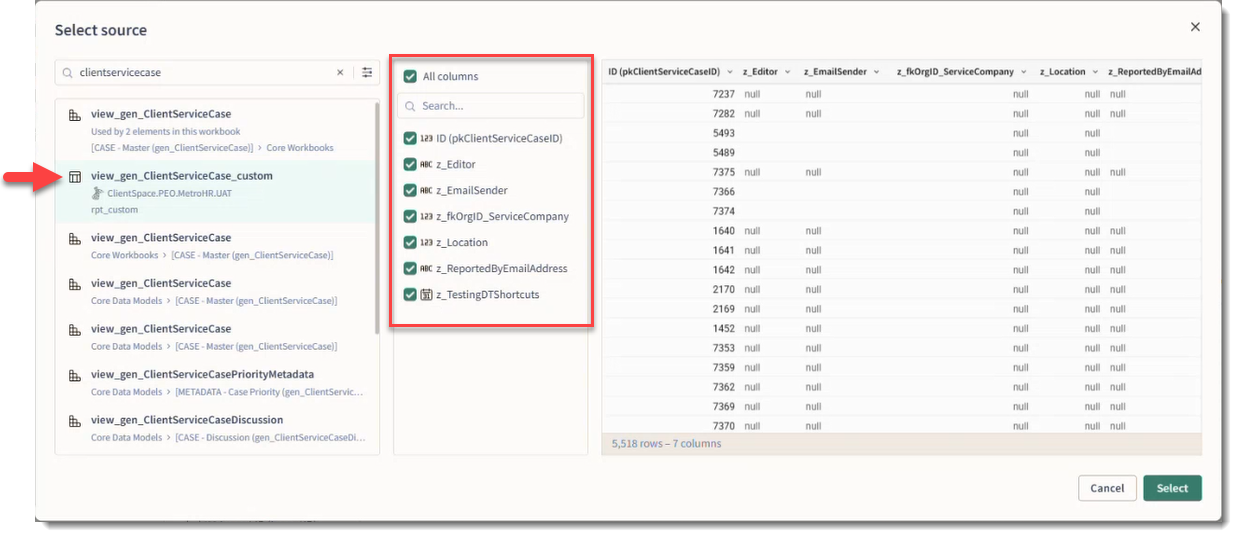
For this test, we will click the custom view named view_gen_ClientServiceCase_custom to select it. (If you do not have this view, you can select a different custom view for testing purposes.)
Note that when you select the custom view, the Primary Key as well as all custom fields (beginning with "z_") are listed. Additionally, a snapshot of data in the fields displays in the grid located to the right of the field listing. The presence of "null" indicates no data in the fields, which may indicate a newly created field where no data exists yet.
-
Uncheck the checkboxes next to the fields you do not want to add (or uncheck All columns and check the checkboxes next to the fields you want to add.) Then, click Select.
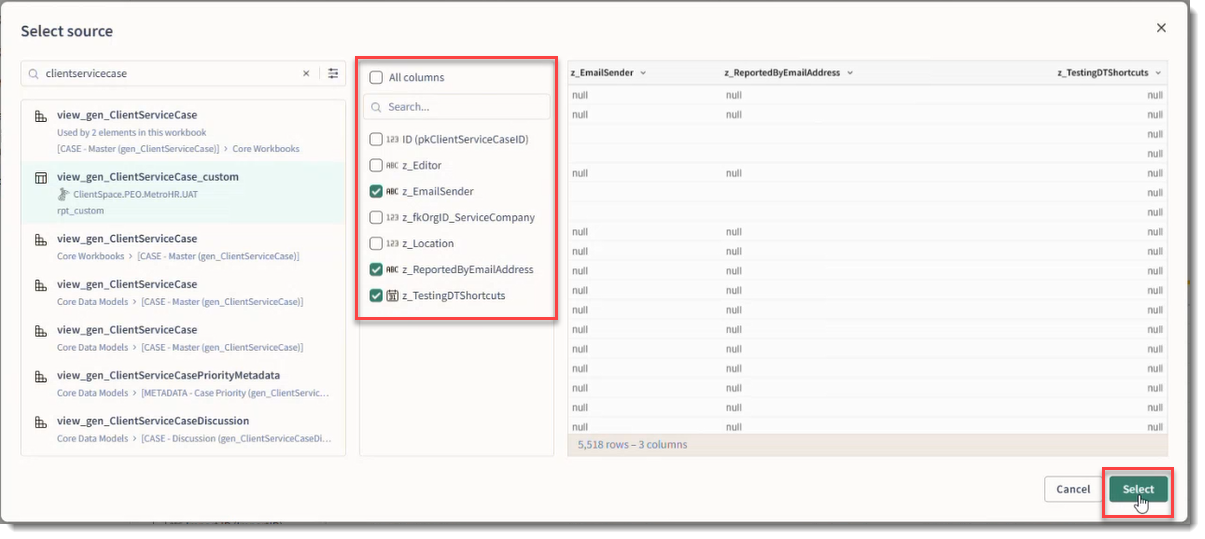
The join configuration fields display along with Join Output table below it. The Join Output table displays the columns being used in the join, including the columns you just added.
-
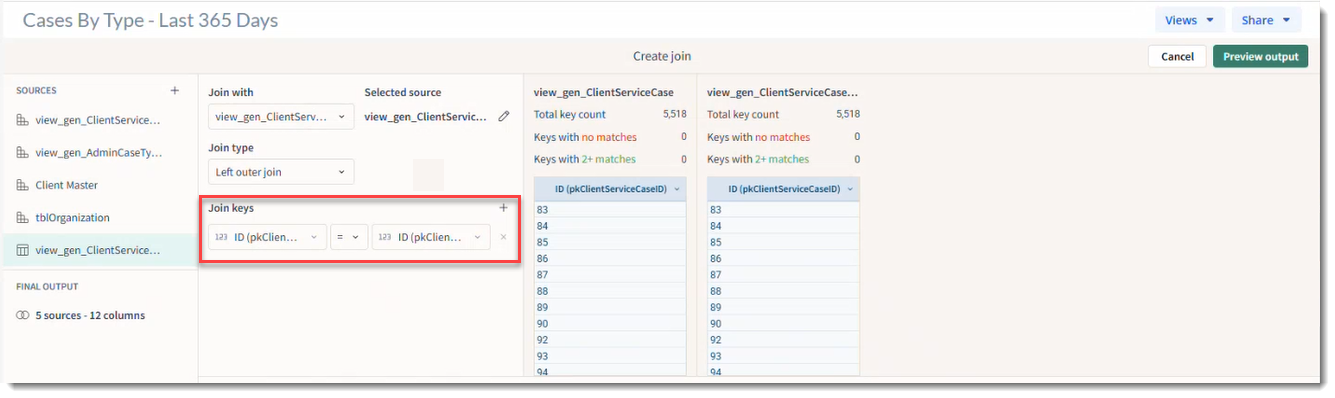
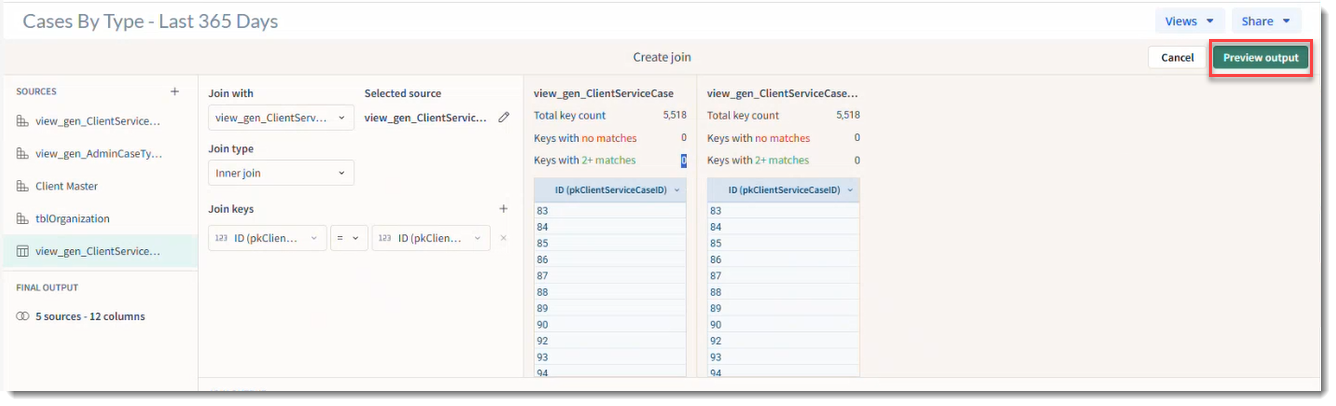
Review the Join keys.
Notice that Report Center attempts to create the join for you. In this case, it found the relationship between the primary key fields in both the original source and the newly added source and filled in the Join Keys. When Primary Key naming conventions are consistent, this "auto assist" works. Therefore, in this instance, we will keep the settings. However, you should always review Join keys and make manual changes as necessary.
-
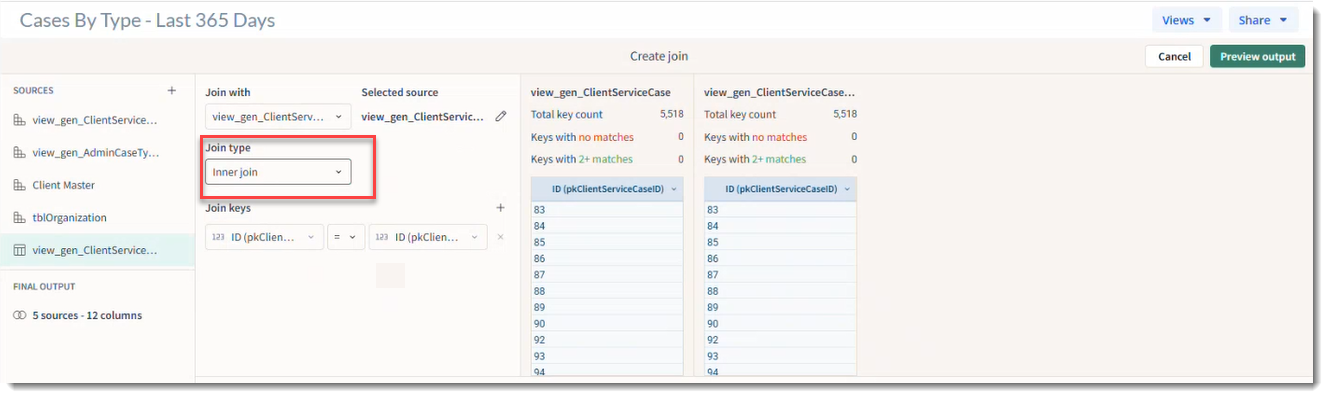
Review the Join type.
Report Center has automatically set join type to "Left outer join". For a more efficient report that runs faster, we typically recommend changing this to "Inner join".
-
Review the Total key count. Notice in the example screenshot above that there is a one-to-one match of the Total key count for both the data model and the custom data source. For both data sources, there are no keys with no matches and no keys with more than two matches. There is one row for each record in both tables. This is indicative of a healthy join.
-
Click Preview Output.
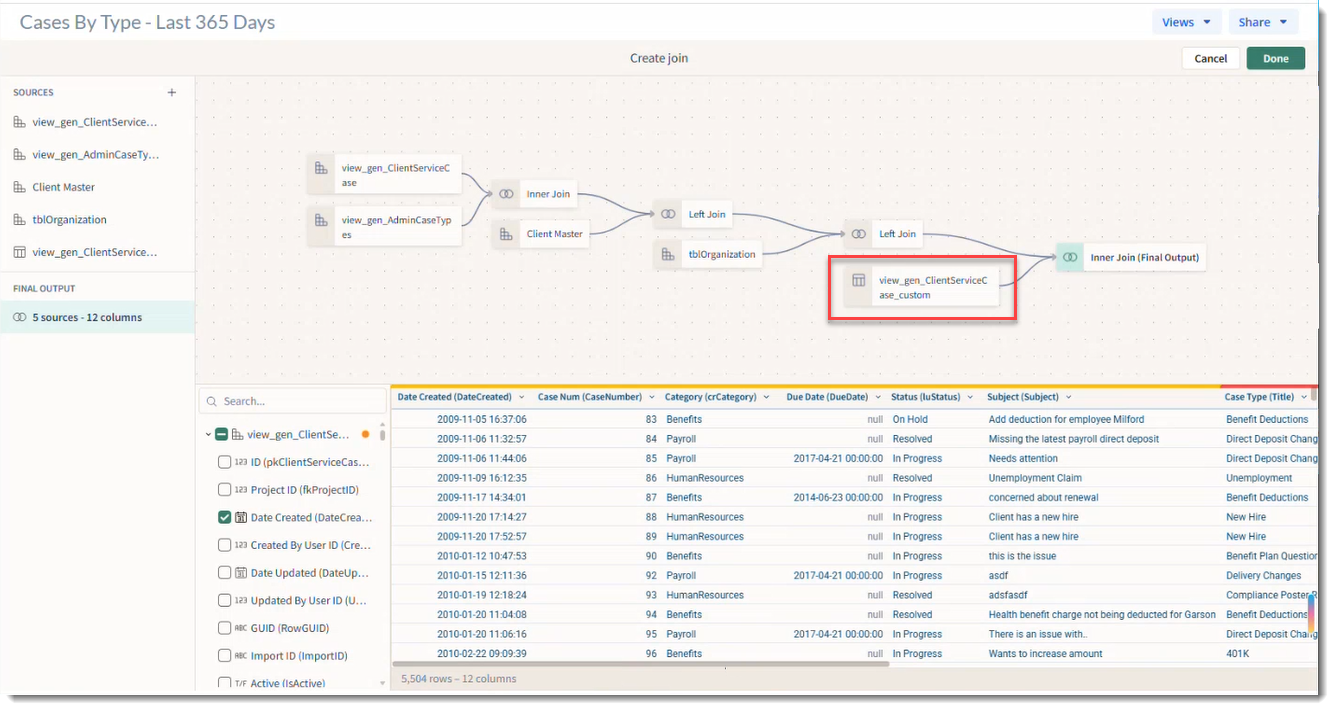
A join diagram is generated which includes the new custom datasource. A preview of the data with the join settings applied is also displayed in the bottom grid. If you use the horizontal scroll bar at the bottom of the grid, you can view the data associated with the columns you just added.
-
Click Done to close the diagram. This takes you back to the tab which displays the pie chart and grid.
-
Creating ClientSpace Custom Dataform Links Using Report Center Workbooks or Views
-
Creating ClientSpace Widgets Using Report Center Workbooks or Views