Generating the Client Profitability Report
You generate the report from the Client Profitability link in the Action Center. This link is accessible from the Client Master.
To generate the report:
- From the Client Master, in the Action Center, under Reports, click Client Profitability.
The Client Profitability form opens.
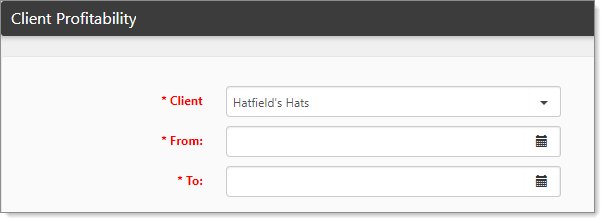
- Edit the fields as required:
|
Client |
Default is the selected client from the Client Master or Workspace landing page. |
|
From |
Use the date picker to select the starting date, or type a date using the format: mm/dd/yyyy. |
|
To |
Use the date picker to select the ending date, or type a date using the format: mm/dd/yyyy. |
- Click Execute.
The report generates and downloads as an Excel spreadsheet.
To view the report:
- Locate your download files and open the spreadsheet.
- Excel opens the report on the Client Summary tab. There are multiple tabs.
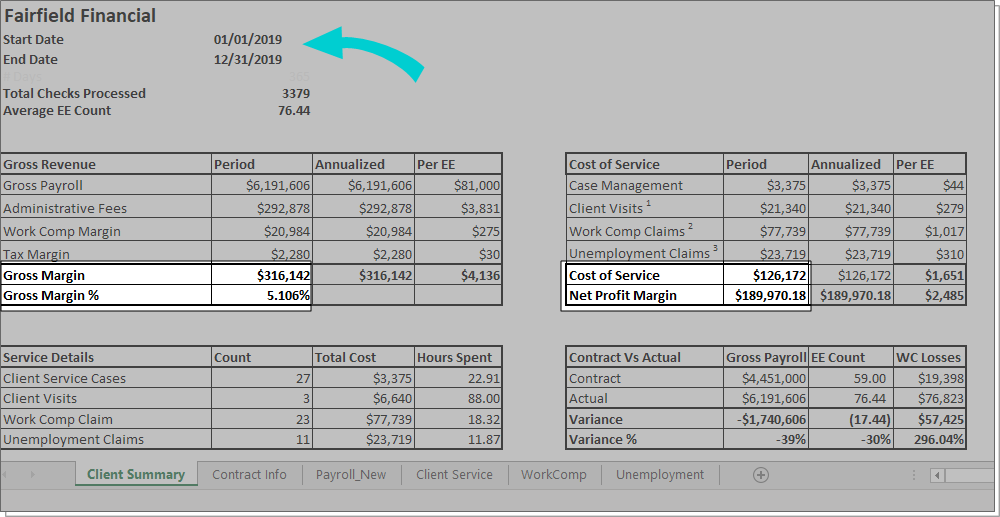
The example shows the date range from January 1 to the end of the year, December 31. The Gross Margin and Cost of Service are highlighted, along with the Net Profit Margin. In this example, while the profit is very positive, there are many costs associated with maintaining this client.
Client Summary
This tab presents a summarized view of the data. This part of the report reveals what it costs you to administer the client compared to your gross margin. The Contract vs. Actual show any variance between the contracted amounts and actual costs.
Contract Info
This tab presents the contract costs – the costs incurred by the company to fulfill the terms of the contract. A summary of the contract data is also presented in the Client Summary tab.
Payroll_New
This tab presents the payroll batch and bill code records. We viewed this data in the Payroll Batch runs and the Billing Voucher records.
Client Service
This tab presents costs associated with visits, cases, and tasks. For tasks, cases, and visits you can see basic information for each record, which also includes time records if applicable. The sum of the total time spent is included in the Cost of Service total on the first tab, Client Summary.
WorkComp
This tab presents the costs associated with Workers' Compensation. It lists the claims that fit your date range. Additionally, if you are tracking time in the claim, the Time Spent column shows much time your staff spent on this activity.
Unemployment
This tab shows the costs of unemployment by employees for the selected date range. Time Spent captures time tracking from ClientSpace.